Math Applications
Accuracy, Precision, and Recall — Never Forget Again!
To design an effective supervised machine learning model, data scientists must first select appropriate metrics to judge their model’s success. But choosing a useful metric often proves more challenging than anticipated, especially for classification models that have a slew of different metric options.
Accuracy remains the most popular classification metric because it’s easy to compute and easy to understand. Accuracy comes with some serious drawbacks, however, particularly for imbalanced classification problems where one class dominates the accuracy calculation.
In this post, let’s review accuracy but also define two other classification metrics: precision and recall. I’ll share an easy way to remember precision and recall along with an explanation of the precision-recall tradeoff, which can help you build a robust classification model.
Model and Data Setup
To make this study of classification metrics more relatable, consider building a model to classify apples and oranges on a flat surface such as the table shown in the image below.

Most of the oranges appear on the left side of the table, while the apples mostly show up on the right. We could, therefore, create a classification model that divides the table down its middle. Everything on the left side of the table will be considered an orange by the model, while everything on the right side will be considered an apple.

What is accuracy?
Once we’ve built a classification model, how can we determine if it’s doing a good job? Accuracy provides one way to judge a classification model. To calculate accuracy just count up all of the correctly classified observations and divide by the total number of observations. This classification model correctly classified 4 oranges along with 3 apples for a total of 7 correct observations, but there are 10 fruits overall. This model’s accuracy is 7 over 10, or 70%.

While accuracy proves to be one of the most popular classification metrics because of its simplicity, it has a few major flaws. Imagine a situation where we have an imbalanced dataset; that is, what if we have 990 oranges and only 10 apples? One classification model that achieves a very high accuracy predicts that all observations are oranges. The accuracy would be 990 out of 1000, or 99%, but this model completely misses all of the apple observations.
Furthermore, accuracy treats all observations equally. Sometimes certain kinds of errors should be penalized more heavily than others; that is, certain types of errors may be more costly or pose more risk than others. Take predicting fraud for example. Many customers would likely prefer that their bank call them to check up on a questionable charge that is actually legitimate (a so-called “false positive” error) than allow a fraudulent purchase to go through (a “false negative”). Precision and recall are two metrics that can help differentiate between error types and can still prove useful for problems with class imbalance.
Precision and Recall
Both precision and recall are defined in terms of just one class, oftentimes the positive—or minority—class. Let’s return to classifying apples and oranges. Here we will calculate precision and recall specifically for the apple class.
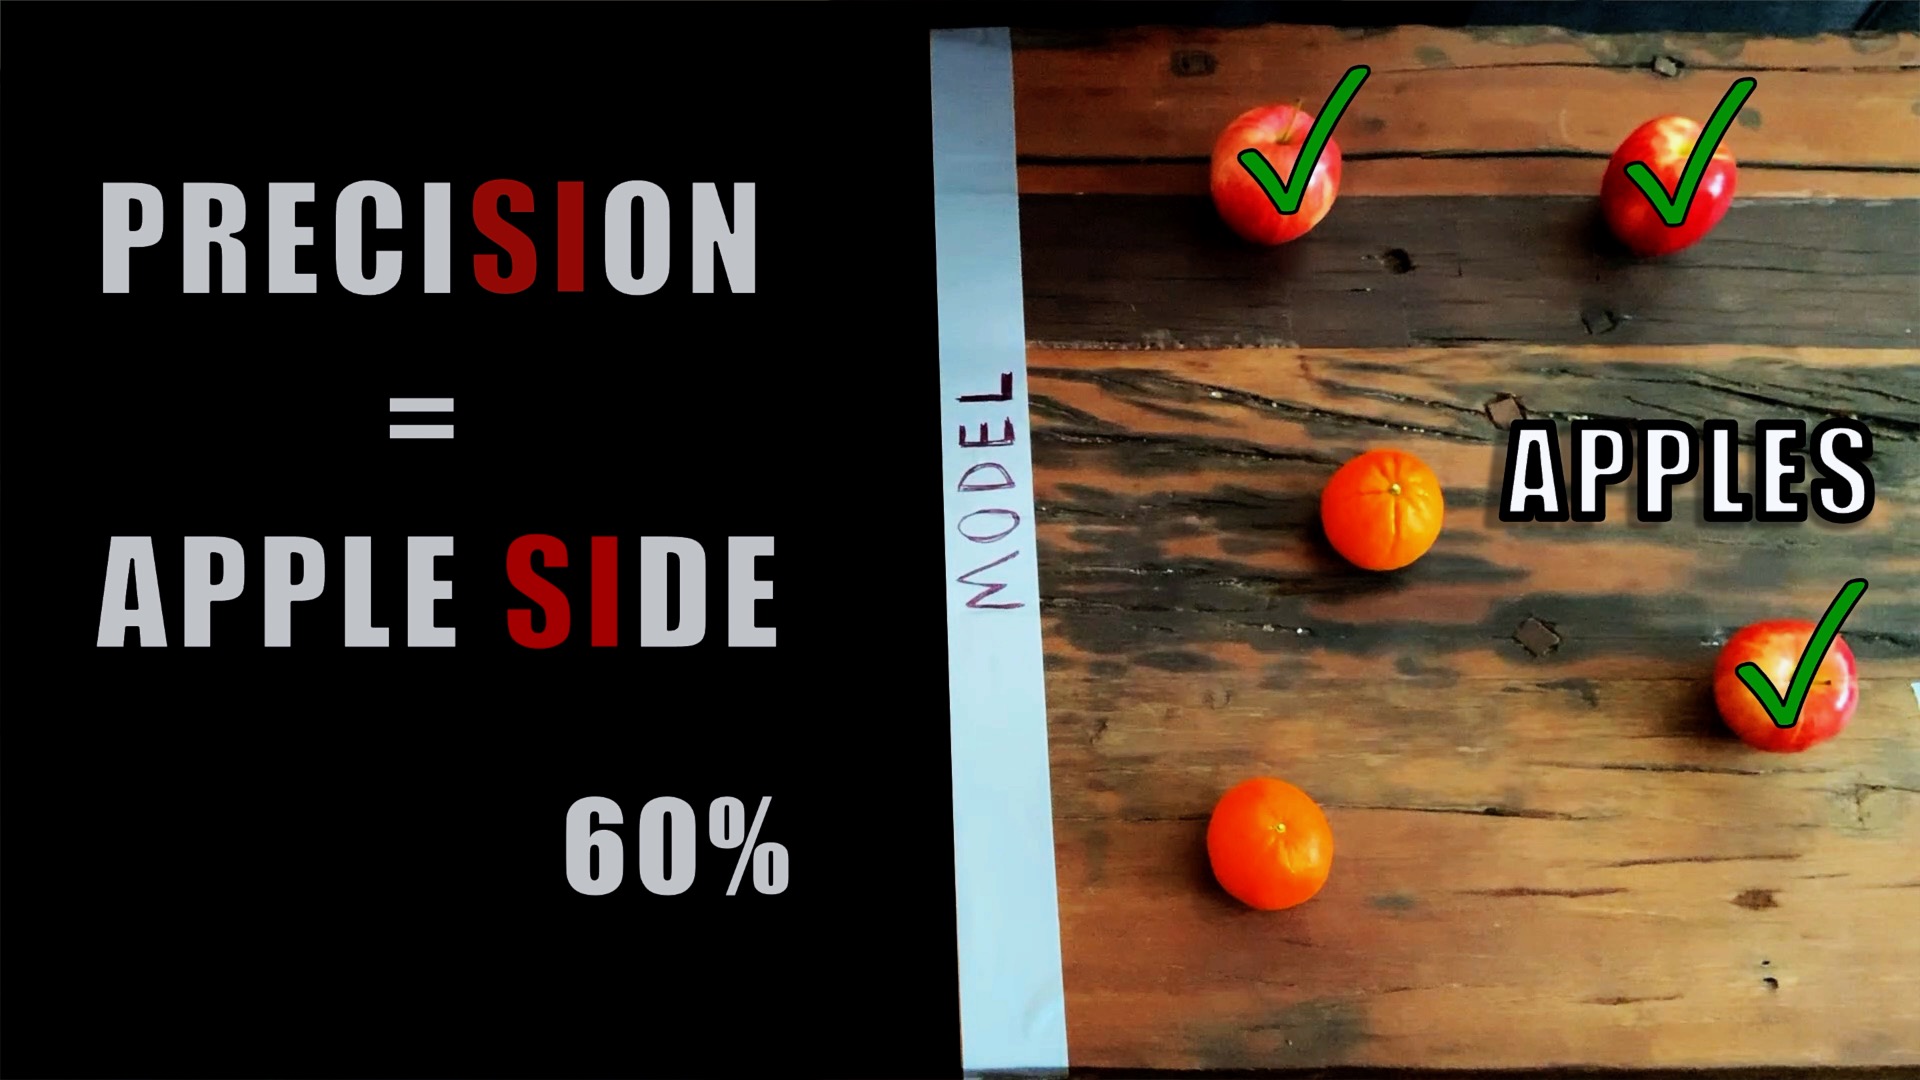
Precision measures the quality of model predictions for one particular class, so for the precision calculation, zoom in on just the apple side of the model. You can forget about the orange side for now.
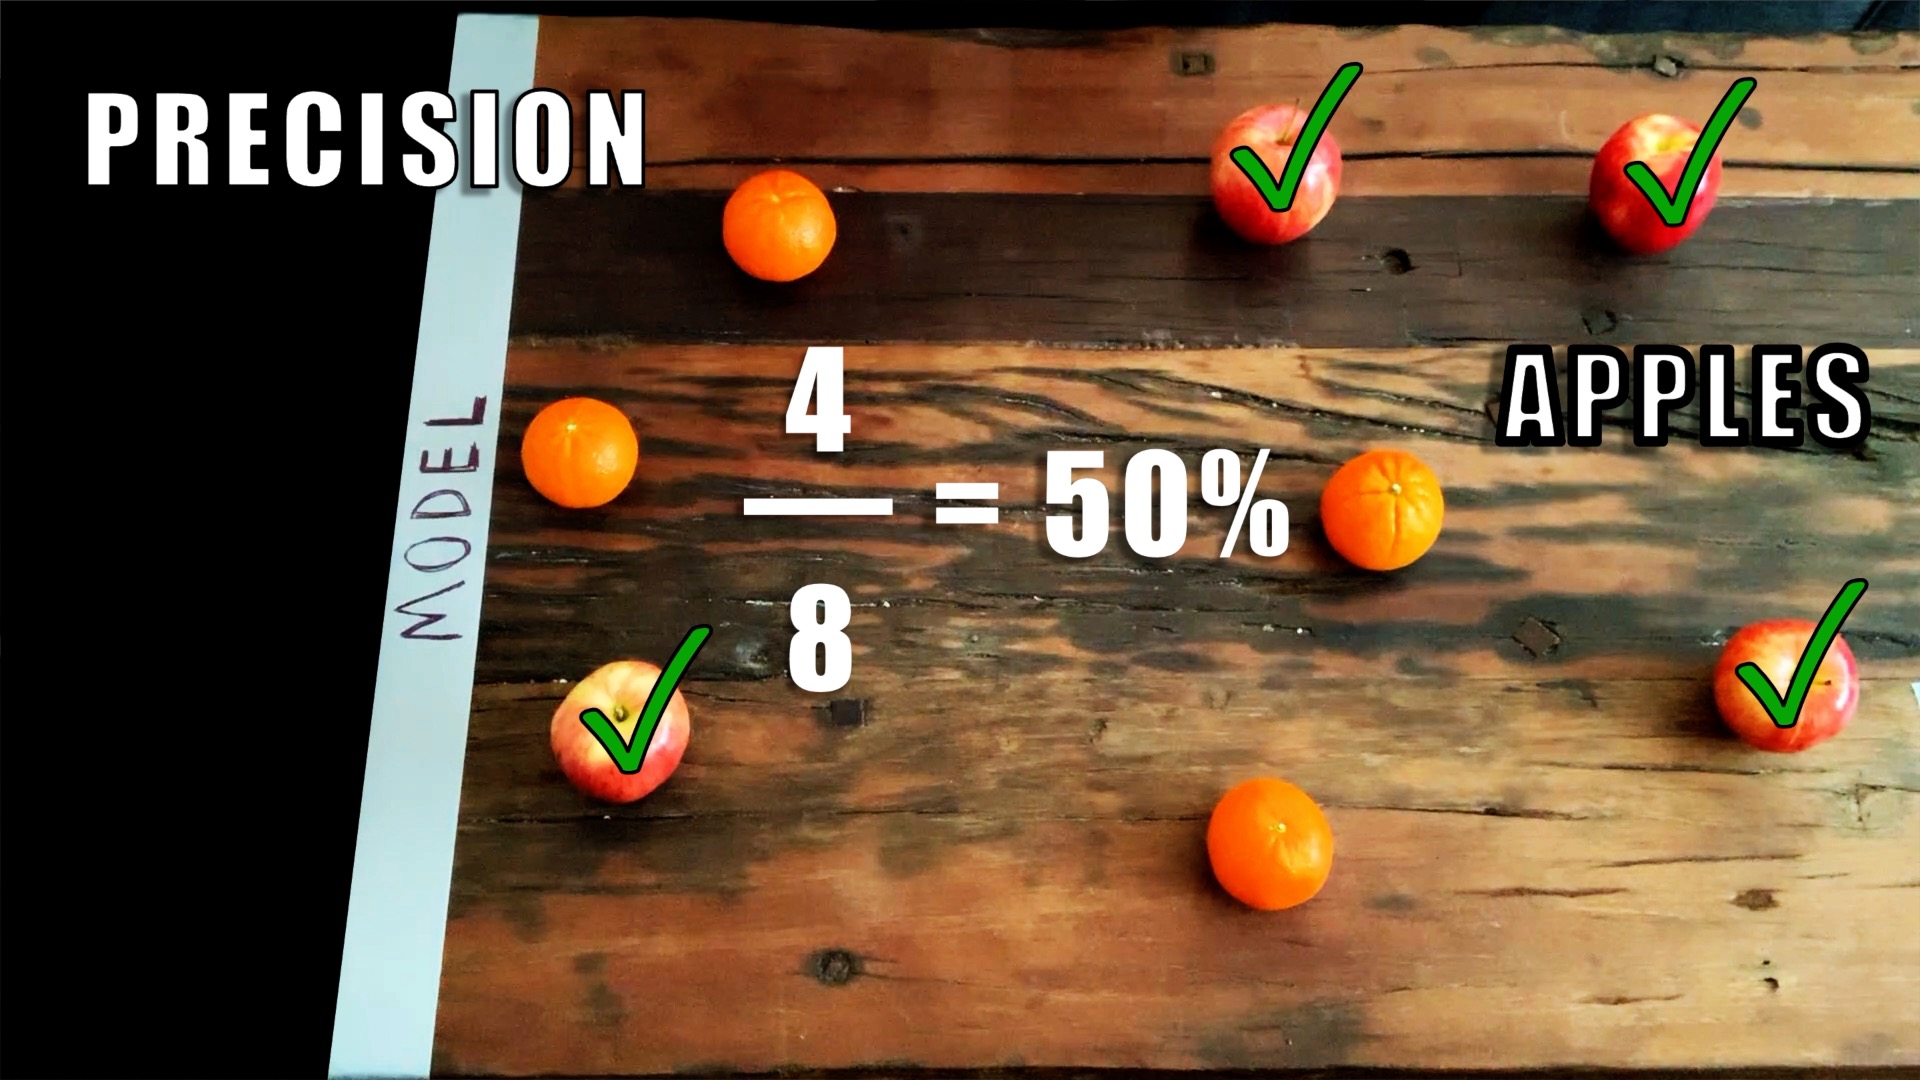
Precision equals the number of correct apple observations divided by all observations on the apple side of the model. In the example depicted below, the model correctly identified 3 apples, but it classified 5 total fruits as apples. The apple precision is 3 out of 5, or 60%. To remember the definition of precision, note that preciSIon focuses on only the apple SIde of the model.
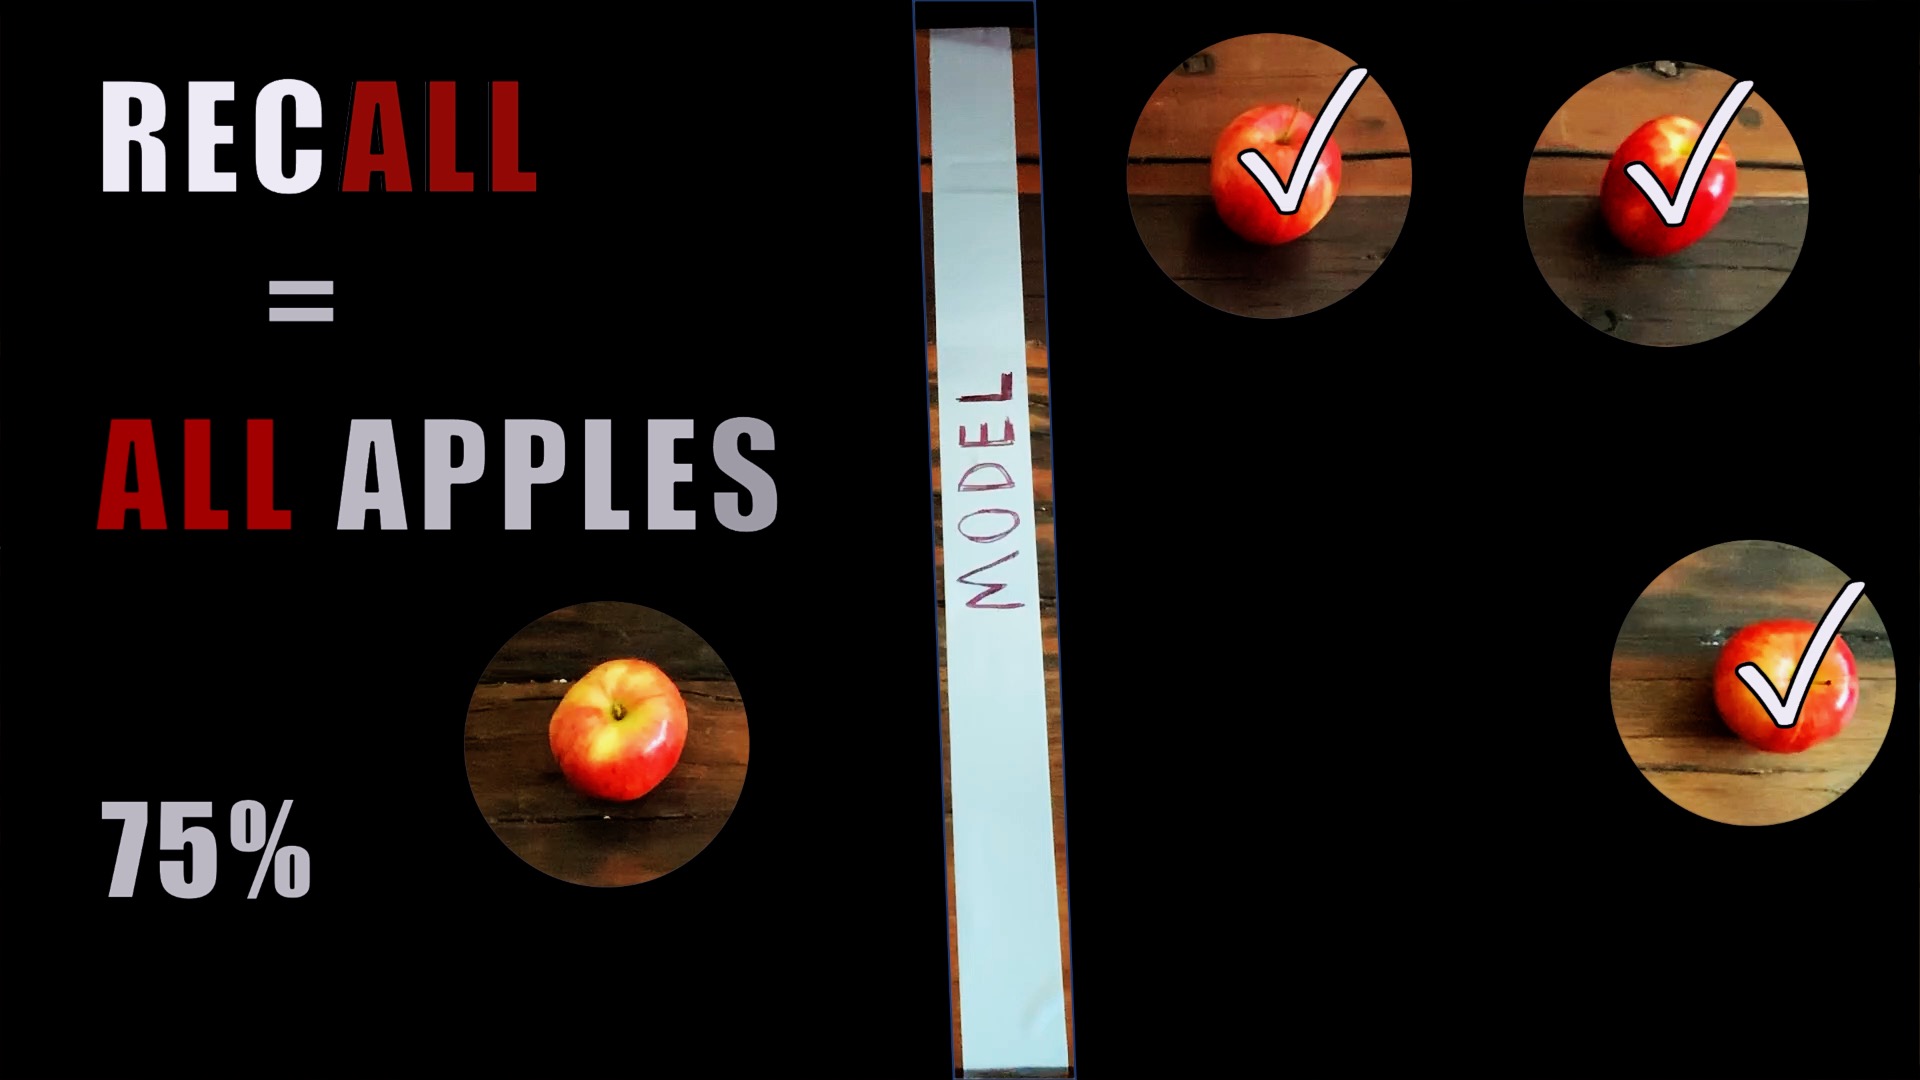
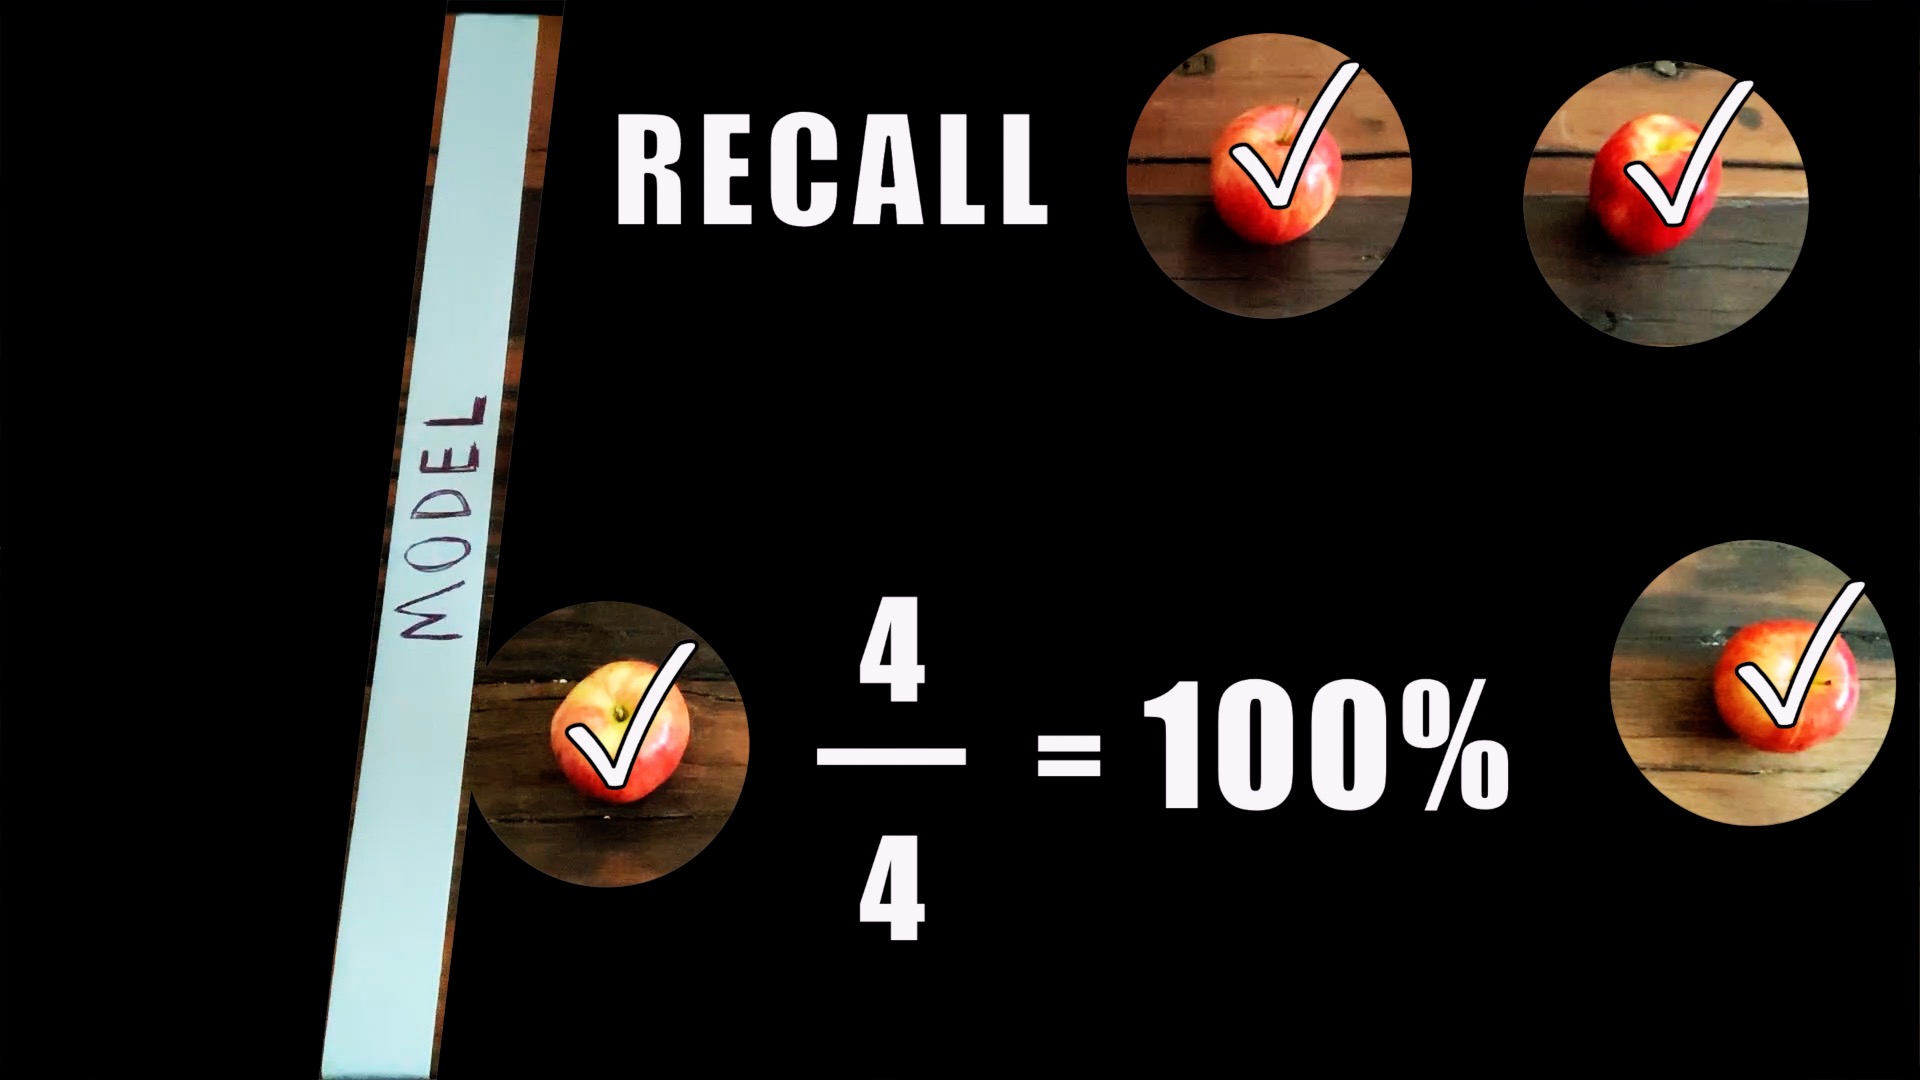
Recall, on the other hand, measures how well the model did for the actual observations of a particular class. Now check how the model did specifically for all the actual apples. For this, you can pretend like all of the oranges don’t exist. This model correctly identified 3 out of 4 actual apples; recall is 3 over 4, or 75%. Remember this simple mnemonic: recALL focuses on ALL the actual apples.
Precision-Recall Tradeoff
So what are the benefits of measuring precision and recall instead of sticking with accuracy? These metrics certainly allow you to emphasize one specific class since they are defined for one class at a time. That means that even if you have imbalanced classes, you can measure precision and recall for your minority class, and these calculations won’t get dominated by the majority class observations. But it turns out that there’s also a nice tradeoff between precision and recall.
Some classification models, such as logistic regression, not only predict which class each observation belongs to but also predict the probability of being in a particular class. For example, the model may determine that a specific fruit has 80% probability of being an apple and 20% probability of being an orange. Models like these come with a decision threshold that we can adjust to divide the classes.
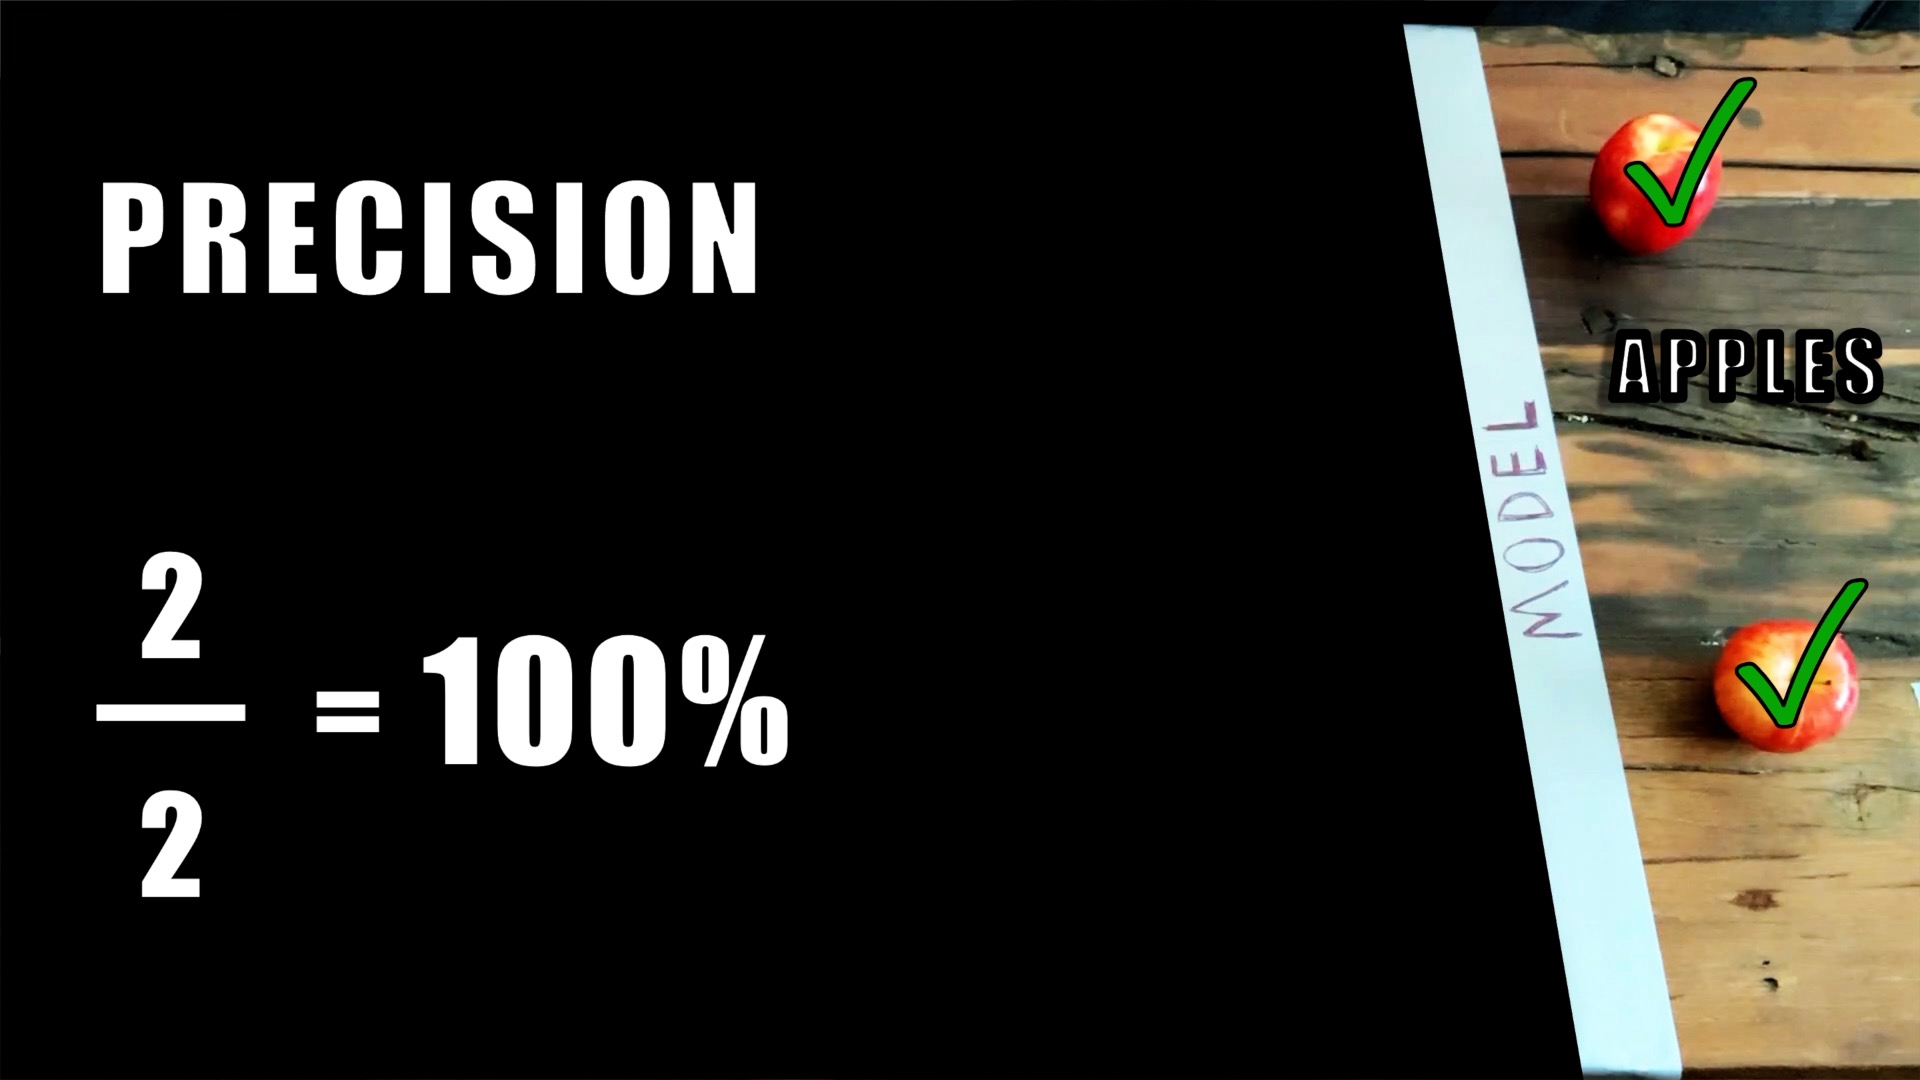
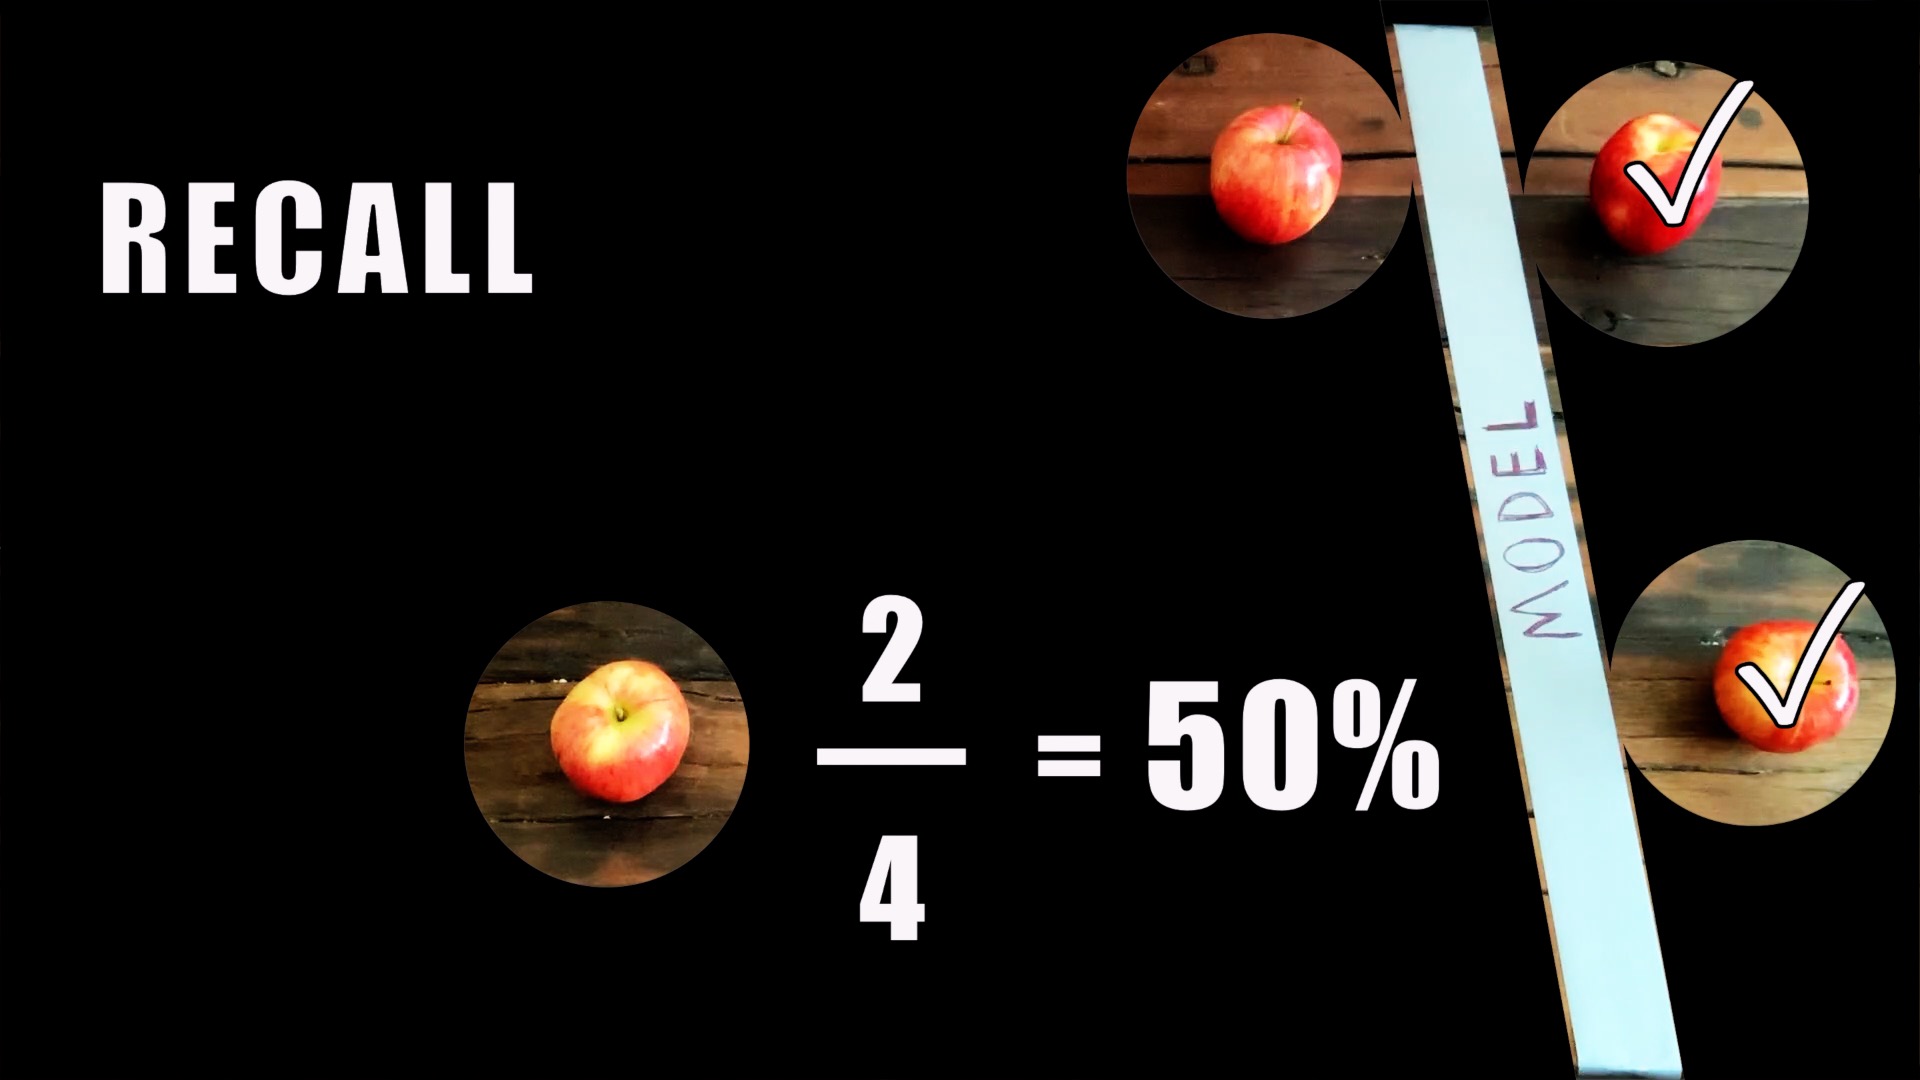
Let’s say you’d like to improve the precision of your model because it’s very important to avoid falsely claiming that an actual orange is an apple (false positive). You can just move the decision threshold up, and precision gets better. For our apple-orange model, that means shifting the model line to the right. In the example image, the updated model boundary yields perfect precision of 100% since all predicted apples are actually apples. When we do this, however, recall will likely decrease because moving the threshold up leaves out actual apples in addition to the erroneous oranges. Here, recall dropped to 50%.
Okay, what if we want to improve recall? We could make our decision threshold lower by moving our model line to the left. We now capture more actual apples on the apple side of our model, but as we do this, our precision likely decreases since more oranges sneak into the apple side as well. With this update, recall improved to 100% but recall declined to 50%.
Monitoring and selecting an appropriate precision-recall tradeoff allows us to prioritize certain types of errors, either false positives or false negatives, as we adjust the decision threshold of our model.
Conclusion
Precision and recall offer new ways to judge classification model predictions as opposed to the standard accuracy computation. With apple precision and recall, we focus in on the apple class. High precision assures that what our model says is an apple actually is an apple (preciSIon = apple SIde), but recall prioritizes correctly identifying all of the actual apples (recALL = ALL apples).
Precision and recall allow us to distinguish between different types of errors, and there’s also a great tradeoff between precision and recall because we can’t blindly improve one without often sacrificing the other. The balance between precision and recall can also help us build more robust classification models. In fact, practitioners often measure and try to improve something called the F1-score, which is the harmonic average between precision and recall, when building a classification model. This ensures that both metrics stay healthy and that the dominant class doesn’t overwhelm the metric like it generally does with accuracy.
Choosing an appropriate classification metric is a critical early step in the data science design process. For example, if you want to be sure not to miss a fraudulent transaction, you’ll likely prioritize recall for cases of fraud. Though in other situations, accuracy, precision, or F1-score may be more appropriate. Ultimately, your choice of metric should be intimately linked to the goal of your project, and once it’s determined, that metric of choice should drive your model development and selection process.
MATHEMATICS · DATA
